

Quantitative risk analysis for the PMI-RMP exam: Monte Carlo, EMV and decision trees on one project

Quantitative analysis answers one question qualitative scoring cannot: how sure are we of the date and the budget? Below, every technique the exam tests is worked on the same hospital project, with a simulator you can run yourself.
Try it: Monte Carlo schedule simulator and decision tree

A six-storey hospital wing is planned for 104 weeks. A $9M government grant is lost if patients are not admitted by Week 104. Run the simulation, then switch to the risk-responses estimates and run it again.

A hospital wing planned for 104 weeks, split into seven activities. Each has an optimistic (O), most likely (M) and pessimistic (P) duration in weeks. Change any number, then run the simulation.

What quantitative risk analysis is, and when the exam expects it

Quantitative risk analysis measures the combined effect of risks on project objectives in numbers — weeks, dollars, percentages of confidence. Qualitative analysis ranks risks one at a time; quantitative analysis tells you what they add up to. It is normally used on the high-priority risks after qualitative scoring, on projects large enough to justify it.

Technique What it answers On the hospital project
Three-point estimate What range could this activity take? Substructure: 23, 26 or 33 weeks
Monte Carlo simulation How likely is each finish date or cost? 1,000 runs of the seven activities
S-curve and P-values What date can we commit to at a given confidence? P50 Week 108, P80 Week 111
Tornado diagram Which inputs drive the result most? Substructure, then services and fit-out
EMV What is a risk worth on average? Contaminated ground: 40% × $1.86M average cost = −$0.74M
Decision tree Which option has the better expected value? Bathroom pods vs site-built

Three-point estimates

Each activity gets an optimistic (O), most likely (M) and pessimistic (P) duration. The PERT mean weights the most likely value: (O + 4M + P) ÷ 6. For the substructure, (23 + 4×26 + 33) ÷ 6 = 26.7 weeks — already later than the 26 in the plan, because the pessimistic tail is long.

Monte Carlo simulation and the S-curve

A simulation picks a random duration for every activity from its range, adds them up, and repeats this a thousand times or more. The results form an S-curve showing the chance of finishing by each week. On the hospital project the plan says 104 weeks, but the simulation gives only about a 7% chance of meeting it. P50 is Week 108 and P80 is Week 111.

The gap is the lesson. Ranges are lopsided — things can go much worse and only a little better — so the most likely finish is later than the sum of the most likely durations.

Tornado diagrams

A tornado diagram ranks inputs by how strongly they move the result. On the hospital project the substructure (driven by possible ground contamination) and the services fit-out (driven by a shortage of fitters) have the longest bars, so that is where risk responses go first.

EMV and decision trees, worked with numbers

Expected monetary value (EMV) is probability multiplied by impact. By convention threats are negative and opportunities positive, and you keep the signs consistent when you add them up.

Option Branches Expected value
Site-built bathrooms 40% chance of a 6-week delay costing $0.72M −$0.288M
Bathroom pods Extra cost −$0.35M; 70% chance of saving $0.48M; 5% chance of losing $0.36M −$0.032M

The pods cost more up front but have the better expected value, by $0.256M, so the decision tree favours them. The option with the lower price is not automatically the better choice once the risks are counted.

Rule for exam questions: include the cost of choosing an option in its branch, write threats as negatives, and compare expected values — not the probability of the best outcome.

Common PMI-RMP exam traps in quantitative analysis

Wrong idea What is actually true
The P50 date is safe to promise P50 means a 50% chance of being later; commitments follow the organisation’s appetite, often P80
Adding most likely durations gives the most likely finish Skewed ranges push the likely finish later; simulation shows by how much
A threat’s EMV is a positive number Threats are negative, opportunities positive
Quantitative analysis replaces qualitative scoring It follows qualitative analysis and focuses on the high-priority risks
Contingency reserve is a fixed percentage It is sized from the analysis, for example P80 cost minus the baseline

Download the quantitative risk analysis workbook

The Excel workbook behind the simulator: three-point estimates, a Monte Carlo sheet that runs a thousand simulations by itself, a tornado chart, EMV table, contingency calculation and the decision tree. Change any estimate and every sheet updates, so you can test your own understanding — or use it on your own project.

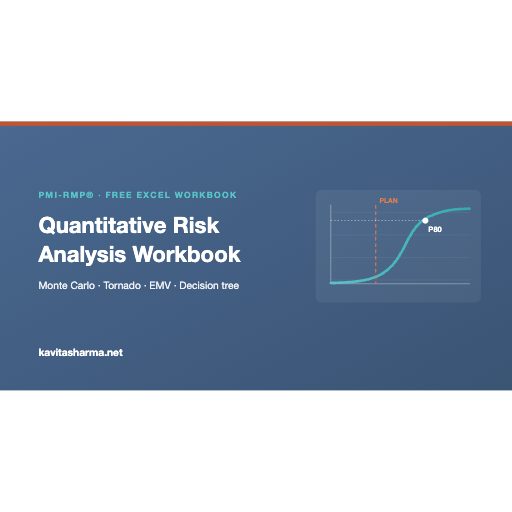
P80 PLAN PMI-RMP® · FREE EXCEL WORKBOOK by Kavita Sharma

Quantitative Risk Analysis Workbook

See how Monte Carlo, EMV and decision trees work by changing the numbers yourself. Every sheet updates as you type, so you understand the answer instead of memorising it.
FREE DOWNLOAD

Send download link to:

Quantitative risk analysis FAQ

Qualitative analysis scores and ranks individual risks by probability and impact. Quantitative analysis measures the combined effect of risks on project objectives in numbers, such as the chance of finishing by a date or within a budget.

P80 is the value you have an 80% chance of meeting or beating. A P80 finish of Week 111 means that in 80% of simulated runs the project finished in Week 111 or earlier.

Multiply the probability of a risk by its impact. A threat with a 40% chance of costing $0.9M has an EMV of −$0.36M. Add the EMVs of a set of risks to see their combined expected value.

It ranks the inputs of a model by how strongly each one moves the result. The longest bars show where uncertainty matters most, which is where risk responses help most.

Risk Analysis is 23% of the PMI-RMP exam and includes both qualitative and quantitative analysis. Expect scenario questions on reading results — P-values, tornado diagrams, EMV and decision trees — rather than long calculations.

This page is Episode 5 of the Riverside Hospital case study, one of ten episodes in the PMI-RMP self-study course. The other nine take the same project from the first risk workshop to handover, with 21 templates, worked answers and three full-length mock exams.

See the PMI-RMP course